In development, so far used internally
Our AI usage, live on the desk.
The AI Usage Display is a small ESP32 display that shows the usage and limits of our AI subscriptions live: the 5-hour window, the weekly limit, the limits of individual models, the extra budget and the API costs. Instead of checking in the browser, a glance to the side is enough.
The displays are part of our everyday work. There is no finished version to buy or install yet.
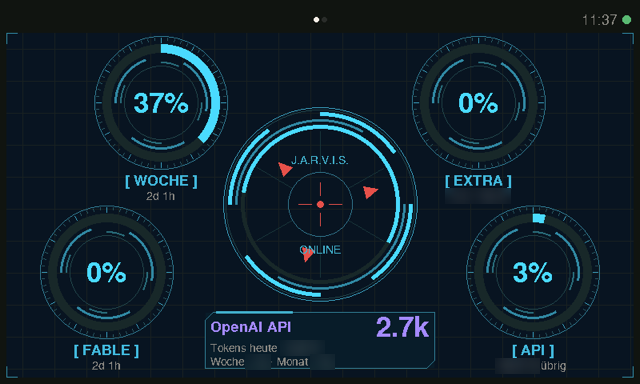
What it shows
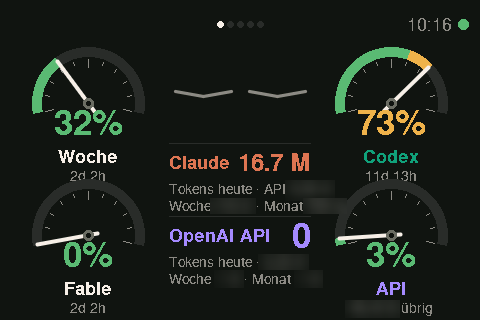
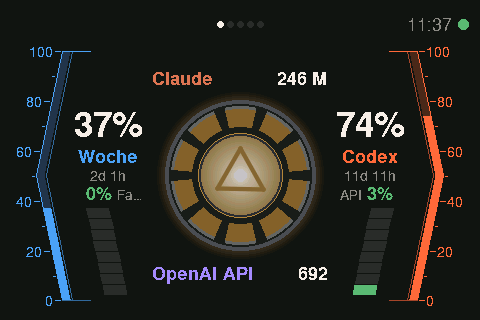
Every gauge shows how much of the quota is already used and when it resets. The colour moves from green to yellow to red as a limit gets closer.
5-hour window
How much of the current time window is used, with a countdown to the reset.
Weekly and model limits
The weekly limit and the limits of individual models, each with the time remaining.
Extra budget
How much of the additionally booked budget is already used.
API costs and tokens
Tokens used and costs of the API accounts for today, the week and the month.
The displays
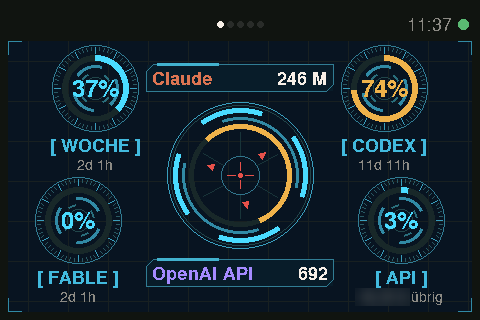
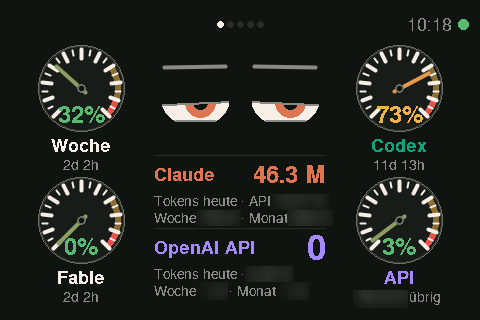
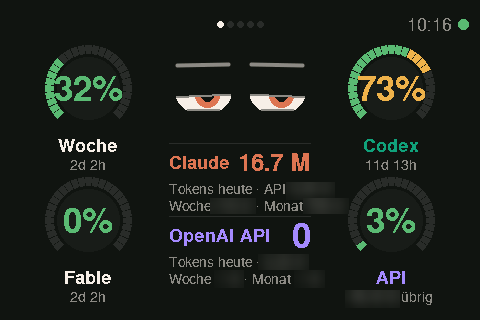
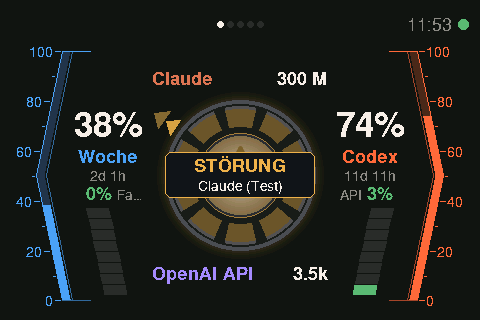
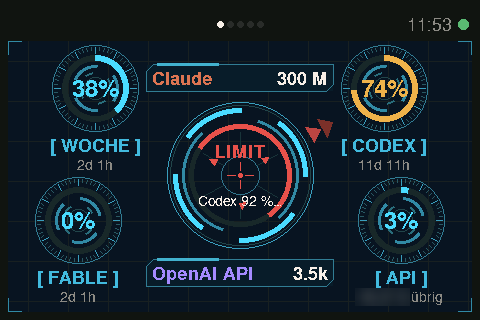
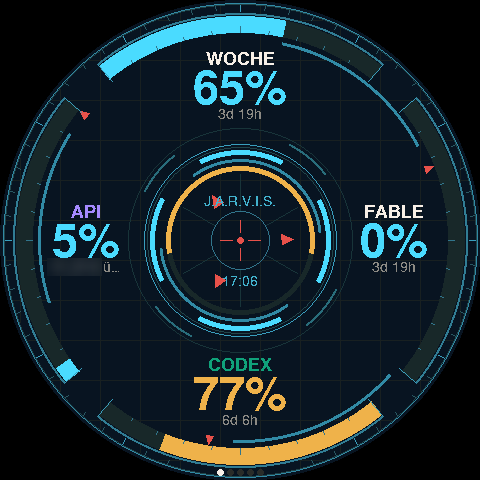
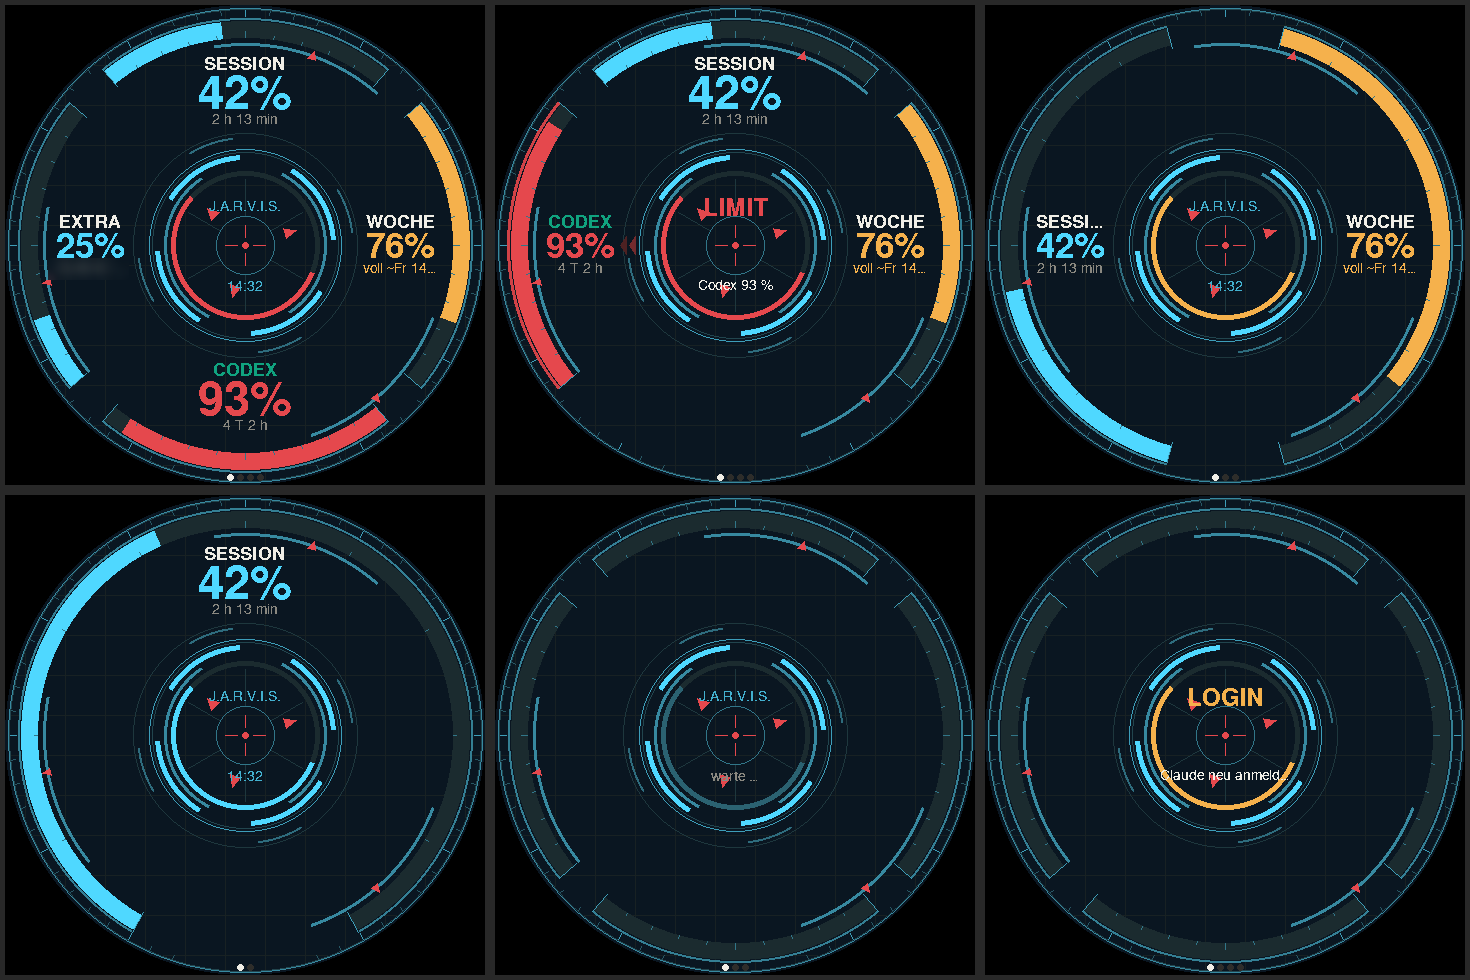
Three form factors, several designs. The images show the screen contents; we have blurred all amounts. Click an image to enlarge it.
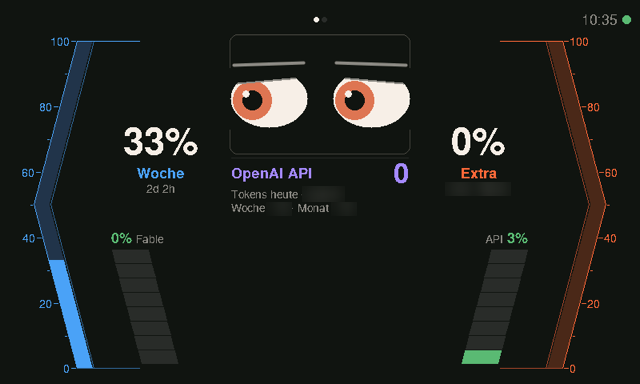
Large display, 4.3 inch
With ESP32-P4 and touch. There is room for every value on one page.
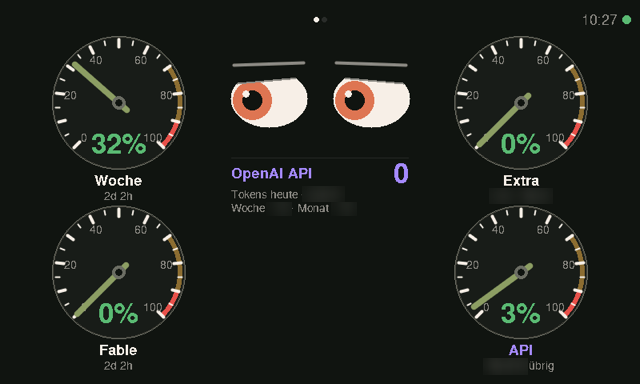
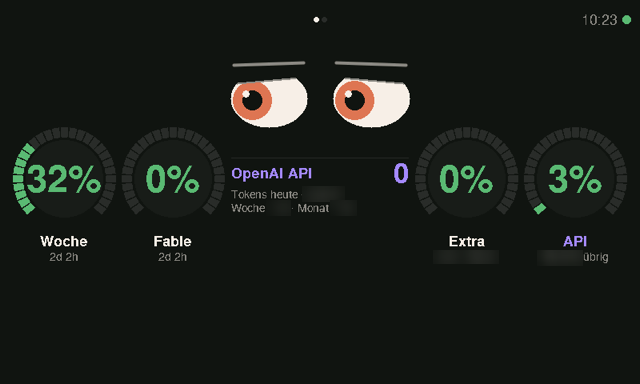
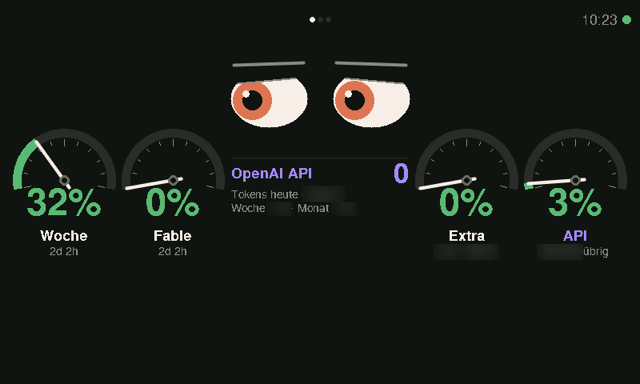
3.5-inch display, 480 × 320
Compact in landscape, with touch. The same designs, plus alerts for outages and limits.
Round display, 480 × 480
2.1 inch with a rotary knob: turning it flips through the views, pressing it confirms.
What the displays can do
Each display fetches the limits itself, so no computer is needed next to it. Besides the AI limits, the displays also show other things from our everyday work.
Several boards
Rectangular and round ESP32 displays in different sizes. Each board is its own building block, and new ones can be added.
Fetched directly by the device
Each display fetches its values itself over an encrypted connection. Optionally, a small relay on the local network distributes the values to several displays.
Selectable designs
Cockpit, Classic, Digital, Sport or Futuristic: you choose the design for each display.
Alerts for outages and limits
If an AI service reports an outage or a limit gets close, the display shows it right away. A status page shows the last few hours as a timeline.
Repositories and builds
A separate page shows the state of our code repositories and whether the latest builds went through.
Doorbell with camera image
When someone rings, the display shows the camera image of the door. Opening the door by touch or with the knob is being tested.
Settings in the browser
Every display has its own settings page: Wi-Fi, display, values and their order. Updates arrive over Wi-Fi.
Several AI services
The values of different AI services sit side by side. You decide which ones are shown and in which order.
Technology
One firmware for all boards; the pure display logic is tested without hardware.
- Hardware
- ESP32, ESP32-S3 and ESP32-P4, rectangular touch displays and a round display with a rotary knob
- Firmware
- C++ with the Arduino framework, built with PlatformIO
- Graphics
- LovyanGFX, custom fonts with umlauts and the euro sign
- Relay (optional)
- Small Python service that distributes the values to several displays on the local network
- Tests
- Unit tests of the display logic directly on the computer, without a board